Doing exploratory, diagnostic and descriptive statistics is the first and very crucial part of any data analytics project.
Here are some more details on each of the steps involved in Exploratory Data Analysis ( EDA)
- Descriptive and Diagnostic Analysis
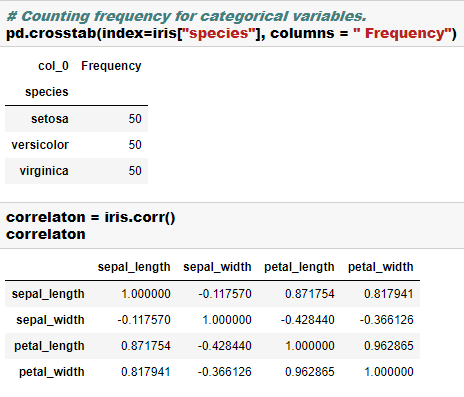
- Types of Variables
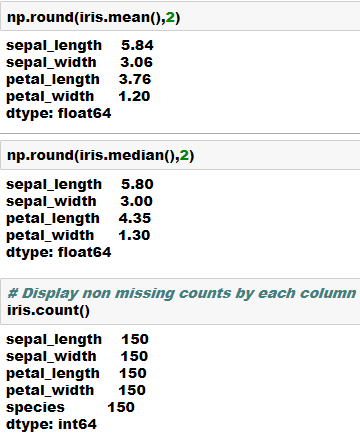
- Mean, Mode, Median
- Univariate and Multivariate analysis
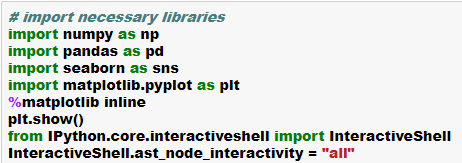
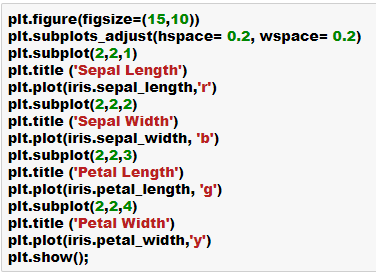
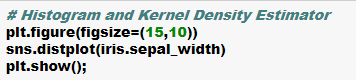
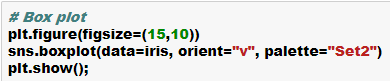
Let’s now look at examples on how to accomplish these tasks in Python.
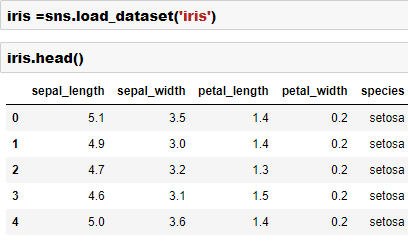
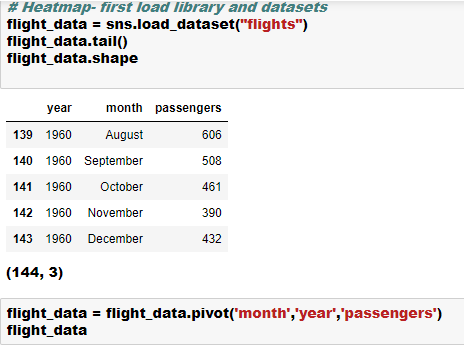
You can find all the inbuilt datasets in the seaborn library using the below command-
seaborn.get_dataset_names()
The following datasets are available-
[‘anscombe’,
‘attention’,
‘brain_networks’,
‘car_crashes’,
‘diamonds’,
‘dots’,
‘exercise’,
‘flights’,
‘fmri’,
‘gammas’,
‘iris’,
‘mpg’,
‘planets’,
‘tips’,
‘titanic’]


Cheers!

Pingback: Learn Python Step by Step | RP's Blog on data science