# - Random Forest Regression on California Housing Dataset
# - RandomizedSearchCV vs GridSearchCV:
# - GridSearchCV exhaustively tries every combination of hyperparameters in the provided grid.
# - RandomizedSearchCV samples a fixed number of random combinations from the grid, making it faster for large search spaces.
# - Both are used for hyperparameter optimization, but RandomizedSearchCV is more efficient when the grid is large or when you want a quick search.
import numpy as np # For numerical operations
import pandas as pd # For data manipulation
import matplotlib.pyplot as plt # For plotting
import seaborn as sns # For advanced visualizations
from sklearn.datasets import fetch_california_housing # To load the dataset
from sklearn.model_selection import train_test_split, GridSearchCV, RandomizedSearchCV # For splitting and hyperparameter search
from sklearn.ensemble import RandomForestRegressor # Random Forest regression model
from sklearn.metrics import mean_squared_error, r2_score # For regression metrics
import warnings # To suppress warnings
warnings.filterwarnings('ignore') # Ignore warnings for cleaner output
# Load California housing dataset
cal_data = fetch_california_housing() # Fetch the dataset
X = pd.DataFrame(cal_data.data, columns=cal_data.feature_names) # Features as DataFrame
y = cal_data.target # Target variable (median house value)
# Train-test split
X_train, X_test, y_train, y_test = train_test_split(X, y, test_size=0.3, random_state=42) # Split data into train and test sets
# Fixed lists for hyperparameters
param_list = {
'n_estimators': [50, 100, 150, 200], # Number of trees in the forest
'max_depth': [5, 10, 15, None], # Maximum depth of the tree
'min_samples_split': [2, 4, 6, 8], # Minimum samples required to split a node
'min_samples_leaf': [1, 2, 3], # Minimum samples required at a leaf node
'max_features': ['sqrt', 'log2', None], # Number of features to consider at each split
'bootstrap': [True, False] # Whether bootstrap samples are used
}
# RandomizedSearchCV for Random Forest Regressor
rf = RandomForestRegressor(random_state=42) # Initialize Random Forest Regressor
random_search = RandomizedSearchCV(
rf, param_distributions=param_list, n_iter=20, cv=3, scoring='neg_mean_squared_error', n_jobs=-1, random_state=42) # Randomized hyperparameter search
random_search.fit(X_train, y_train) # Fit model to training data
print('Best parameters (RandomizedSearchCV):', random_search.best_params_) # Print best parameters
print('Best score (RandomizedSearchCV):', -random_search.best_score_) # Print best score (MSE)
rf_random = random_search.best_estimator_ # Get best model
# GridSearchCV for Random Forest Regressor (commented out)
# grid_search = GridSearchCV(
# rf, param_grid=param_list, cv=3, scoring='neg_mean_squared_error', n_jobs=-1) # Grid hyperparameter search
# grid_search.fit(X_train, y_train) # Fit model to training data
# print('Best parameters (GridSearchCV):', grid_search.best_params_) # Print best parameters
# print('Best score (GridSearchCV):', -grid_search.best_score_) # Print best score (MSE)
# rf_grid = grid_search.best_estimator_ # Get best model
# Evaluate RandomizedSearchCV model
y_pred = rf_random.predict(X_test) # Predict on test set
mse = mean_squared_error(y_test, y_pred) # Calculate mean squared error
r2 = r2_score(y_test, y_pred) # Calculate R^2 score
print(f'\nRandomizedSearchCV Test MSE: {mse:.4f}') # Print test MSE
print(f'RandomizedSearchCV Test R2: {r2:.4f}') # Print test R^2
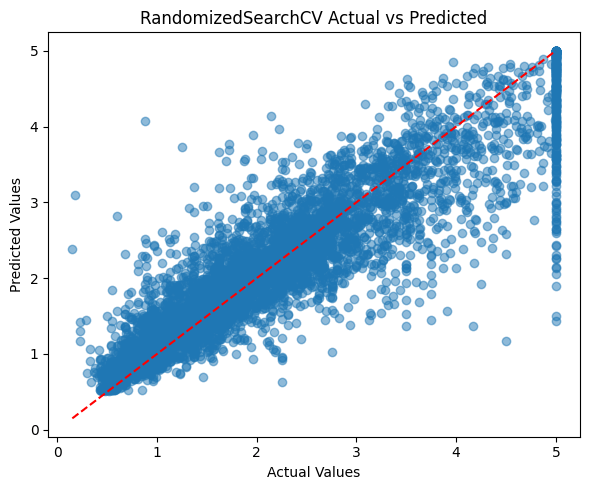
plt.figure(figsize=(6,5)) # Set figure size
plt.scatter(y_test, y_pred, alpha=0.5) # Scatter plot of actual vs predicted
plt.plot([y_test.min(), y_test.max()], [y_test.min(), y_test.max()], 'r--') # Diagonal reference line
plt.xlabel('Actual Values') # X-axis label
plt.ylabel('Predicted Values') # Y-axis label
plt.title('RandomizedSearchCV Actual vs Predicted') # Plot title
plt.tight_layout() # Adjust layout
plt.show() # Show plot
# Feature importance visualization for best RandomizedSearchCV model
importances = rf_random.feature_importances_ # Get feature importances
indices = np.argsort(importances)[::-1] # Sort features by importance
plt.figure(figsize=(8,5)) # Set figure size
plt.bar(range(X.shape[1]), importances[indices], align='center') # Bar plot of importances
plt.xticks(range(X.shape[1]), [X.columns[i] for i in indices], rotation=45) # Feature names as x-ticks
plt.title('Feature Importances (RandomizedSearchCV Best Model)') # Plot title
plt.tight_layout() # Adjust layout
plt.show() # Show plot
# Visualize a single tree from the Random Forest
from sklearn.tree import plot_tree
plt.figure(figsize=(20,10))
plot_tree(rf_random.estimators_[0], feature_names=X.columns, filled=True, max_depth=2)
plt.title('Random Forest Regression: Example Tree (Depth=2)')
plt.show()













You must be logged in to post a comment.