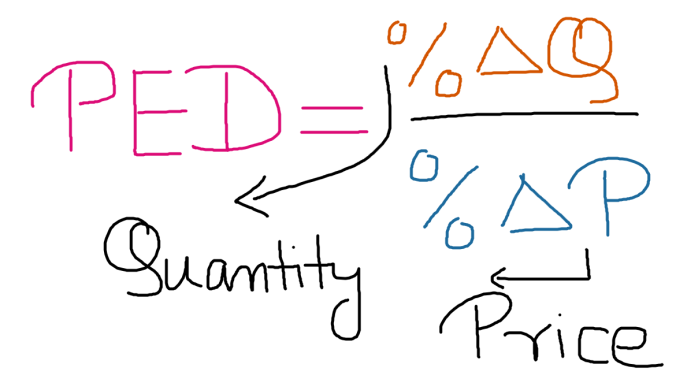
Price elasticity of demand (PED) is a measure that has been used in econometric to show how demand of a particular product changes when the price of the product is changed. More particularly, it measures the % change in demand of a product when the price changes by 1%.
It can be expressed as the following formula-

Let’s look at example- Let’s say that demand of a particular Bluetooth headset decreases by 2% when the price is increased by 1%. In this case the PED will be defined as = -2%/1% or -2.
Now, let’s talk about how we interpret PED-
PED of greater than 1 (absolute value) shows highly elastic product. In other words, the change in price will cause a more than proportionate change in demand. This is generally the case with non-essential or luxury products such as the example shown above. On the other hand, PED of less than 1 shows relatively inelastic products such as groceries and daily necessities. Furthermore, for most product PED will be negative, i.e. when the price is increased demand falls.
There are few other practical applications of PED that we should be aware of-
- PED for a given product or product category can change over time and hence it’s imperative to measure PED over of time.
- PED for a given product or product category can vary by customer segments. For example, low income customers may have higher PED for the same product
- Pricing of a product should be optimized taking in account the PED. For example, if a product is showing lower price elasticity or inelasticity, pricing can be increased on the product to maximize revenue
Here is an article that gives some examples from the retail world.
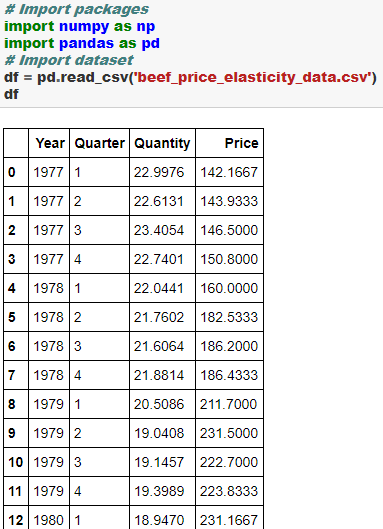
Let’s now step into how we can estimate PED in Python. For this, we will working with the beef price and demand data from USDA Red Meat Yearbook-
http://usda.mannlib.cornell.edu/MannUsda/viewDocumentInfo.do?documentID=1354
You can download the data from here
We will be building a log-log linear model to estimate PED. Please see here for the theoretical discussion on this topic. The coefficient from the log-log linear model shows the PED between two factors.
Let the Python show begin! In the below example PED comes out to be -0.53. It shows that when the price of beef is increased by 1% the demand for beef falls by 0.53%


Cheers!
Pingback: Learn Data Science using Python Step by Step | RP's Blog on data science
Could you share the full python file? Not clear whether all the code is showing. TIA.
LikeLike
can we use the distribution data along with Price, if we can how do we interpret the results?
LikeLike