| Color | Field | What it means |
|---|---|---|
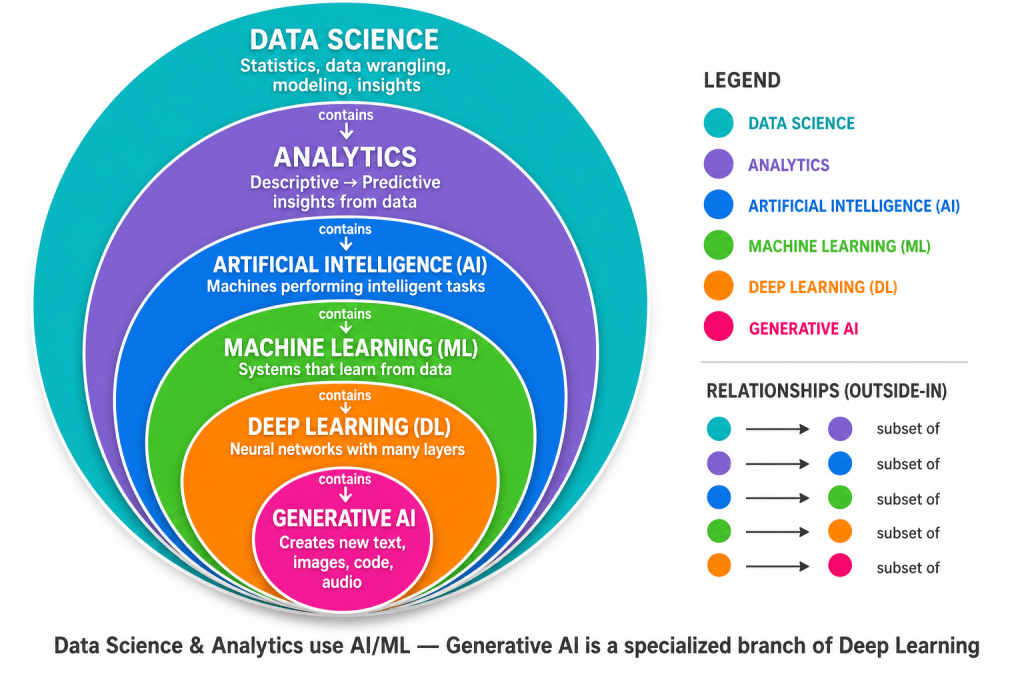
| Teal | Data Science | The broadest field — using data, statistics, and tools to find patterns and solve problems |
| Purple | Analytics | Turning data into insights (what happened, why, what might happen next) |
| Blue | AI | Machines doing tasks that usually need human intelligence |
| Green | ML | AI that learns from data instead of following only fixed rules |
| Orange | DL | ML using deep neural networks (many layers) |
| Magenta | Generative AI | DL systems that create new content — text, images, code, audio |
Real-world examples
- Analytics: “Sales dropped 12% in Q3” (dashboards, reports)
- ML: “This customer is likely to churn” (prediction from data)
- DL: “This MRI scan shows a tumor” (image recognition)
- Generative AI: “Write me a summary of this report” (creating new content)
Features and Labels
Core idea
| Role | What it is | Example |
|---|---|---|
| Feature | Input used to predict or find patterns | age, income, click_count |
| Label | Output you want to predict or explain | churned, house_price |
Main terminology
| Concept | Data Science / ML | Statistics | Other popular names |
|---|---|---|---|
| Feature | Feature | Predictor, Independent variable (IV), Covariate, Regressor | Input, Attribute, Variable, Column, Dimension, Field |
| Label | Label, Target | Response, Dependent variable (DV), Outcome | Output, Ground truth, Y, Class, Category |
Features = what you know (inputs). Labels = what you want to predict (outputs). Different fields use different words for the same roles.
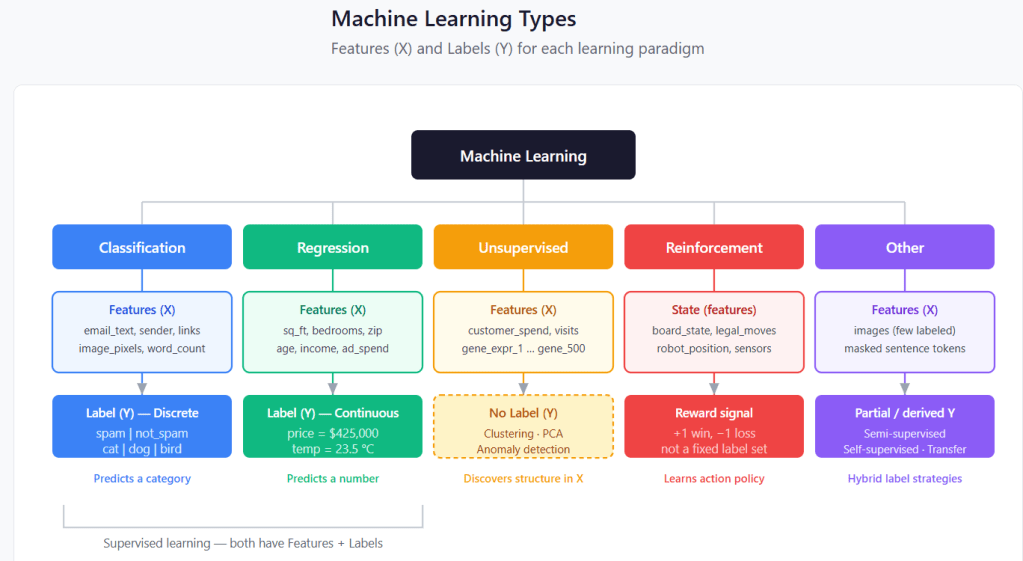
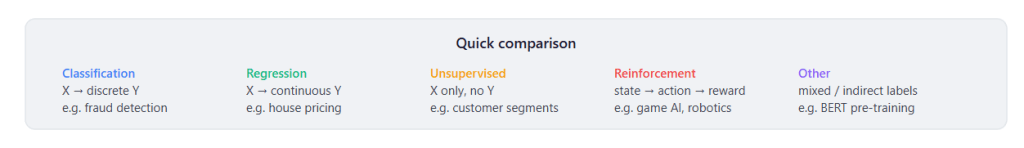
Classification
Supervised learning where the label is a category (discrete class). The model learns to assign new inputs to one of a fixed set of classes.
Example — Email spam filter: Features include email text, sender domain, and number of links. The label is spam or not_spam.
Regression
Supervised learning where the label is a number (continuous value). The model learns to predict a quantity on a numeric scale.
Example — House price prediction: Features include square footage, bedrooms, and zip code. The label is the sale price (e.g. $425,000).
Unsupervised
Learning from features only — no labels. The model finds hidden structure such as groups, compressed representations, or outliers.
Example — Customer segmentation: Features include annual spend and visit frequency. The model groups customers into clusters like “loyal” or “at-risk” without predefined labels.
Reinforcement
An agent learns by taking actions and receiving reward signals through trial and error — not from a fixed labeled dataset.
Example — Chess AI: State is the board position. The agent picks a move and gets +1 for a win, −1 for a loss. It learns a strong move policy over time.
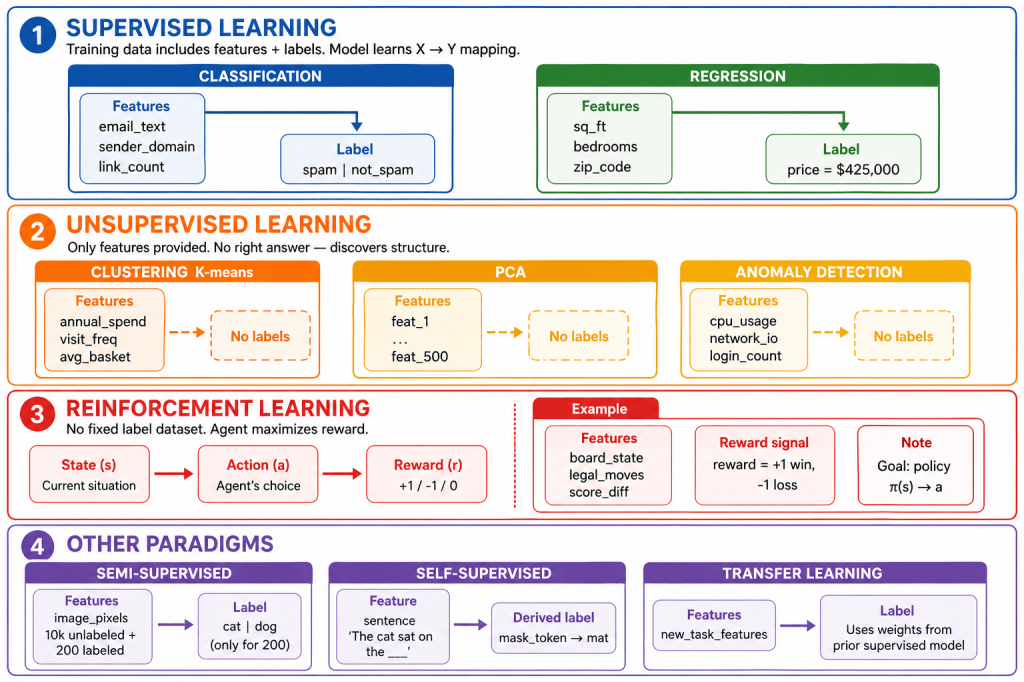
Semi-supervised
Combines a small labeled set with a large unlabeled pool when labels are expensive to collect.
Example — Medical imaging: 200 labeled X-rays (tumor / no_tumor) plus 10,000 unlabeled scans to classify new images.
Self-supervised
Labels are created from the data itself to learn useful representations before a downstream task.
Example — BERT pre-training: “The cat sat on the ___” → predict mat → later fine-tuned for sentiment analysis.
Transfer learning
Reuses a model trained on one task and adapts it to a new, related task with limited data.
Example — Product classifier: 50 labeled product photos, starting from an ImageNet-trained model, to classify new products accurately.
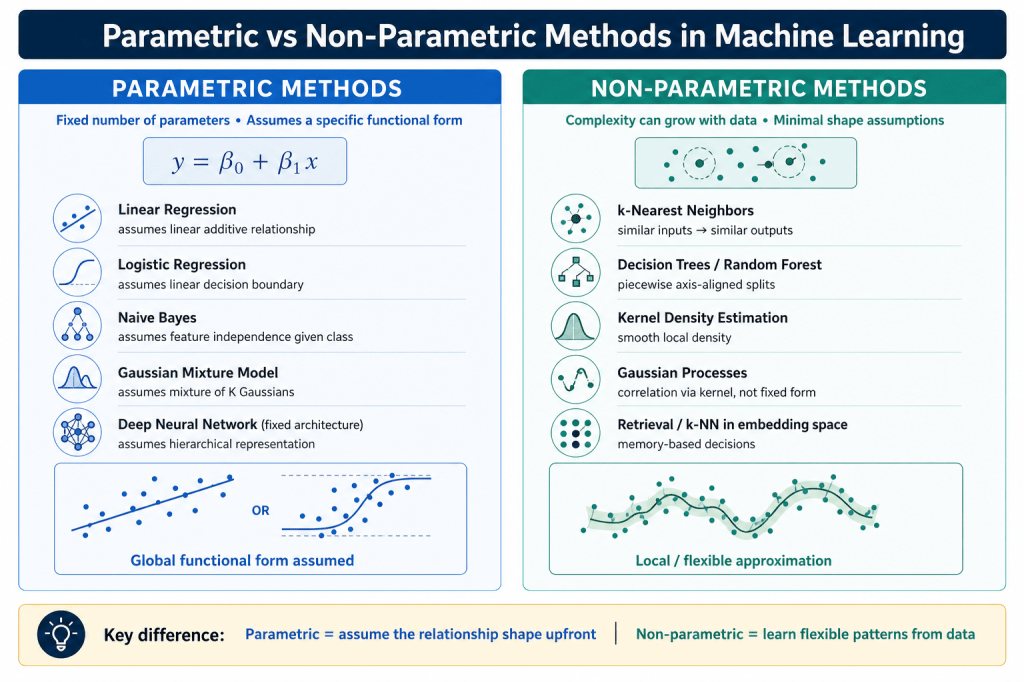
Parametric vs Non-Parametric Methods in Machine Learning
Parametric methods assume the relationship between inputs and outputs has a fixed shape before you train. You only estimate a set number of parameters — for example, the slope and intercept in linear regression. The model stays the same size whether you have 100 data points or 100,000.
Non-parametric methods do not lock in one global shape. They learn patterns more flexibly from the data, and their complexity can grow as you add more data. They often rely on ideas like “similar examples should give similar answers” rather than “the relationship is always a straight line.”
Simple analogy
- Parametric: You decide the recipe is “a straight line” and only learn how steep it is and where it starts.
- Non-parametric: You don’t decide the shape upfront. You let the data guide a more flexible fit, like connecting nearby points or splitting the space into regions.
Examples
- Parametric: linear regression, logistic regression, Naive Bayes, Gaussian mixture models, neural networks with a fixed architecture.
- Non-parametric: k-nearest neighbors, decision trees, kernel methods, Gaussian processes.
Main tradeoff
- Parametric: simpler, faster, easier to interpret — but wrong if your assumed shape doesn’t match reality.
- Non-parametric: more flexible, better for complex patterns — but usually needs more data and can overfit more easily.

You must be logged in to post a comment.