Three statements, one picture of the business
There are three main financial statements used to assess the financial health of a business.
- Balance sheet. A snapshot of assets, liabilities, and equity on one date.
- Income statement, or profit and loss statement. Revenues, expenses, and profit or loss over a period.
- Cash flow statement. Cash that came in and cash that went out over that same period.
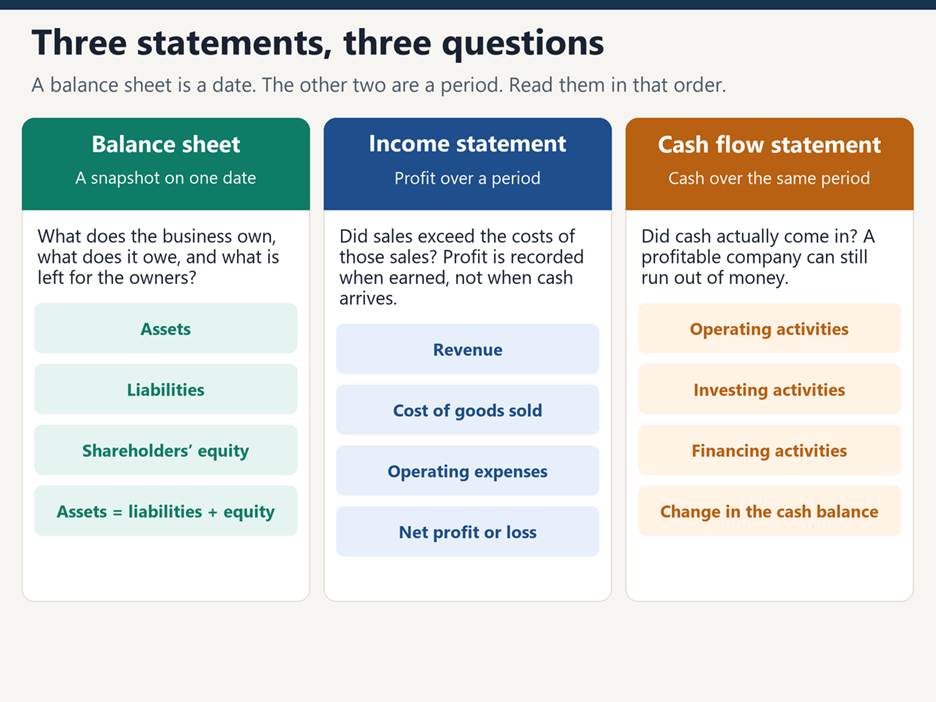
The three pages answer different questions. The balance sheet says what the company owns and owes today. The income statement says whether the period was profitable. The cash flow statement says whether that profit arrived as cash. A company can look fine on one page and strained on another. The work is to read them together.
The balance sheet
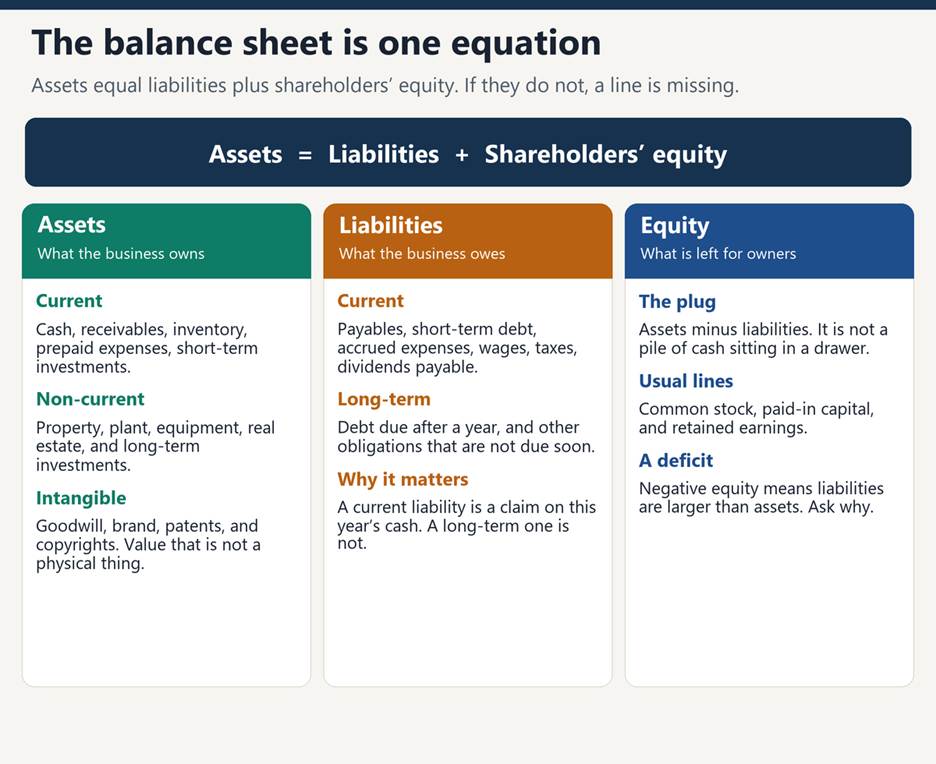
A balance sheet has three main components at a given date.
- Assets (A). Things of value the business owns. They can be tangible or intangible.
- Liabilities (L). Amounts the business owes, or other obligations.
- Shareholders’ equity (SE). Assets minus liabilities. The accounting identity is A = L + SE.
Assets
Assets are things of value that will benefit the business and its stockholders. A useful split is by how soon they turn into cash.
Current assets
- Cash and cash equivalents, such as deposits and short-term investments
- Accounts receivable: cash that customers owe the business
- Inventory
- Prepaid insurance and other prepaid expenses
- Short-term investments
Non-current assets
- Property, plant, and equipment
- Real estate and other long-term investments
Intangible assets
- Goodwill
- Brand
- Patents
- Copyrights
Goodwill is not cash and it is not a machine. It is the leftover when a company pays more for an acquisition than the identifiable assets are worth. It stays on the balance sheet until a test says the acquisition is no longer worth that price. A rising asset total that is mostly goodwill is a different story from a rising asset total that is mostly cash or stores.
Activity 1. Open the balance sheets of these companies and write down what you see in the assets.
- Walmart
- Sears Holdings
- Infosys
- Apple
- Google (Alphabet)
- Alibaba
- American Airlines
- MakeMyTrip
- Macy’s
For each one, note which company has the highest and the lowest assets now, what the trend has been, and what might be driving it. Yahoo Finance still shows the statements. The figures in the update below come from the company filings, which is the better source when the two disagree.
Liabilities
Liabilities are what the business owes. The same current and long-term split matters here, because a bill due this year has to be paid from this year’s cash.
Current liabilities
- Accounts payable
- Short-term debt
- Accrued liabilities
- Dividends payable
- Wages
- Taxes
Other liabilities
- Long-term debt
- Other liabilities that are not due within a year
Accounts payable at a retailer is often a sign of strength, not distress. Suppliers deliver inventory and wait to be paid. The retailer sells the inventory, sometimes before the supplier is paid. That is free financing, until the suppliers lose confidence and shorten the terms.
Activity 2. Using the same nine companies, look at liabilities. Which balance sheet carries the most, and the least? What is the trend, and what is driving it?
Shareholders’ equity
Equity is assets minus liabilities. It is the residual claim of the owners if the assets were used to pay the liabilities. It is not a cash balance. A company can have large equity and very little cash, or the reverse.
Typical lines include retained earnings, common stock, capital surplus, and paid-in capital. Retained earnings are profits that were not paid out as dividends. When a company pays dividends and buys back stock faster than it earns, retained earnings can fall, and can go negative, even while the business is healthy. That is a different negative from the one created by years of losses.
The income statement
The income statement is also called the profit and loss statement. It measures profit during a period. It uses accrual accounting: sales and expenses are shown in the period they occur, not in the period the cash is collected or paid. Cash can arrive before the revenue is recorded, or after it.
A typical statement runs like this.
- Revenue
- minus cost of goods sold
- equals gross profit
- minus operating expenses, including selling, general and administrative costs, and research and development
- equals operating profit
- then interest, other items, and tax
- equals net profit
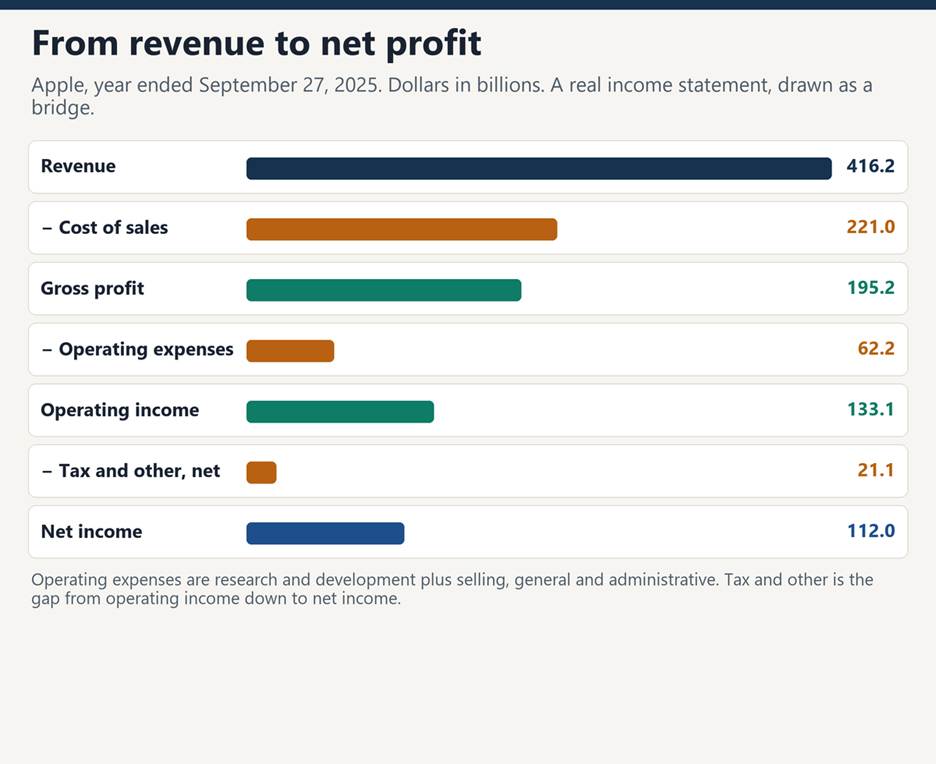
Gross profit shows what is left after the direct cost of the goods or services. Operating profit shows what is left after the cost of running the company. Net profit is what is left after interest and tax. A high gross profit and a thin net profit usually means the burden is below the gross-profit line: overhead, interest, or tax.
The cash flow statement
The cash flow statement shows how cash entered and left during the period. Profit without cash is a problem. A company can report a profit and still be unable to pay wages, suppliers, or debt.
There are three sections.
- Cash from operating activities. Cash from the main business. In a healthy company this is higher than, or roughly equal to, net income. A healthy company also generates most of its cash here, rather than from investing or financing.
- Cash from investing activities. Buying and selling longer-term assets and investments. A growing company often shows a negative number here, because it is spending.
- Cash from financing activities. Issuing or repaying debt, issuing or buying back stock, and paying dividends.
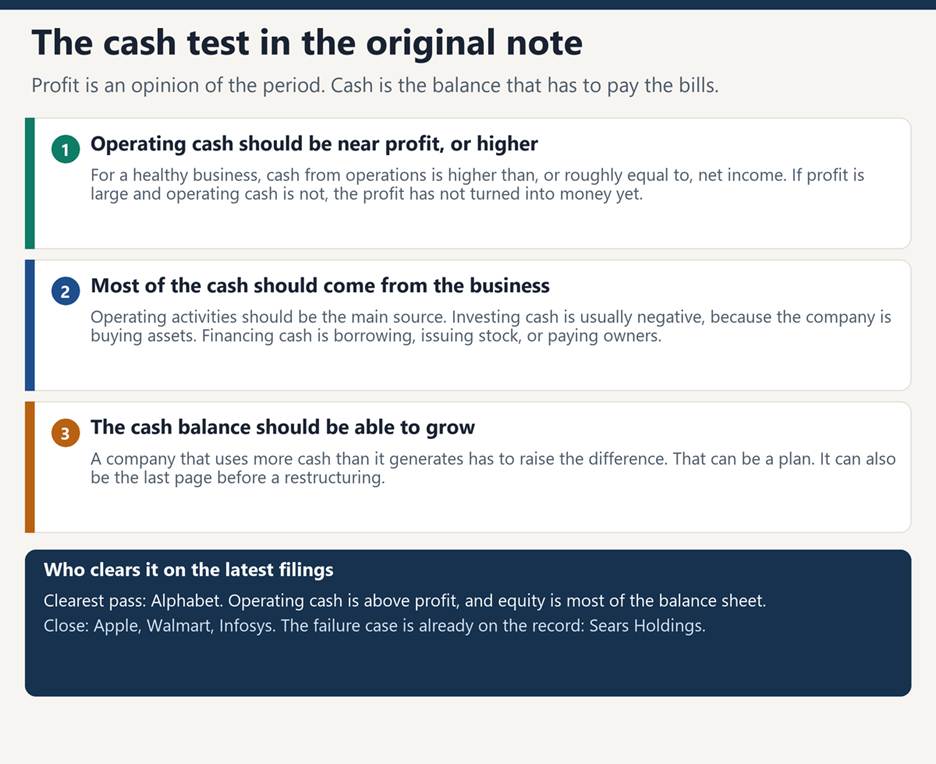
At the bottom, the three sections explain the change in the cash balance. Over time, a healthy business generates more cash than it uses, and the cash it can call on grows. “Cash” in that sentence includes short-term investments that can be sold quickly. Looking only at the checking-account line misses the marketable securities sitting next to it.
Activity 3. If you had to invest $1 million in one of the nine companies, using only the balance sheet, the income statement, and the cash flow statement, which company would you choose, and why? What has the year-over-year trend been in the key metrics of that company?
Activity
The original activities ask for a comparison. The filings below are the latest full year available for each company as of October 2026. They do not share a fiscal year-end. Sears Holdings is the exception: it has no current statements. Its last full year as a reporting company is included because the activity still names it, and because the ending is the lesson.
Dollars are billions and are rounded, so a row will not always add to the penny. Equity is the residual that makes assets equal liabilities plus equity, except where a small mezzanine or redeemable interest sits outside both. Walmart’s profit is the amount attributable to Walmart. Macy’s revenue is net sales. Infosys cash is free cash flow, the dollar figure the company publishes. The others are cash from operations.
| Company | Year | Assets | Liabilities | Equity | Revenue | Net income | Cash |
| Alphabet | 2025 | 595.3 | 180.0 | 415.3 | 402.8 | 132.2 | 164.7 |
| Apple | FY2025 | 359.2 | 285.5 | 73.7 | 416.2 | 112.0 | 111.5 |
| Walmart | FY2026 | 284.7 | 178.5 | 105.9 | 713.2 | 21.9 | 41.6 |
| Alibaba | FY2026 | 276.8 | 113.6 | 162.1 | 148.4 | 14.8 | 11.0 |
| American Airlines | 2025 | 61.8 | 65.5 | (3.7) | 54.6 | 0.1 | 3.1 |
| Infosys | FY2026 | 16.4 | 6.6 | 9.8 | 20.2 | 3.3 | 3.7 |
| Macy’s | FY2024 | 16.4 | 11.9 | 4.6 | 22.3 | 0.6 | 1.3 |
| Sears Holdings | FY2017 | 7.3 | 11.0 | (3.7) | 16.7 | (0.4) | — |
| MakeMyTrip | FY2026 | 1.75 | 1.81 | (0.06) | 1.04 | 0.05 | 0.18 |
Sorted by assets, Alphabet is the largest and MakeMyTrip is the smallest. That ranking is not a ranking of quality. MakeMyTrip’s revenue is a fee on travel booked through the platform. In the year ended March 31, 2026, gross bookings were $10.4 billion and revenue was $1.04 billion. Walmart’s $713 billion is the merchandise itself. Comparing the two asset totals without that distinction makes the travel company look trivial and the retailer look uniquely vast. Both numbers are real. They measure different things.
Worked answer for Activity 1: assets
Highest now: Alphabet, $595 billion at December 31, 2025, up from $450 billion a year earlier. Lowest among companies that still report: MakeMyTrip, $1.75 billion at March 31, 2026. Sears is lower still, at $7.3 billion on its last balance sheet, and that number is frozen in 2018.
What sits inside the asset number is the useful part.
| Company | What the assets mostly are | What moved them |
| Alphabet | Property and equipment were $247 billion, up from $171 billion. Cash and marketable securities were $127 billion. | Assets rose by $145 billion in a single year. The largest piece was data-center and technical infrastructure, alongside a rise in long-term debt from $11 billion to $47 billion. |
| Apple | Cash and marketable securities were about $132 billion. Property and equipment were $50 billion. Inventory was only $5.7 billion. | Assets edged down, from $365 billion to $359 billion. The company does not need a Walmart-sized warehouse. |
| Walmart | Property and equipment $136 billion. Inventory $59 billion. Cash only $11 billion. Goodwill $29 billion. | Stores, clubs, and the inventory in them. Fiscal 2026 inventory was up 4.3%. |
| Alibaba | Cash and other liquid investments were $75.5 billion. Equity securities and other investments were a large second block. Property and equipment were $41 billion. | Assets rose from RMB 1.80 trillion to RMB 1.91 trillion, or $277 billion at the rate in the fiscal 2026 release. A good share of the asset base is financial, not stores. |
| American Airlines | Aircraft, gates, and the related leases. Assets have been roughly flat, near $62 billion, for three years. | This is a fleet financed over many years. Assets do not grow just because seats were sold. |
| Infosys | Receivables, unbilled revenue, cash, and investments. Almost no inventory. Goodwill and intangibles were $1.6 billion of $16.4 billion. | In rupees, assets rose from ₹148,903 crore to ₹155,967 crore. In dollars they fell, from $17.4 billion to $16.4 billion. The business got larger. The translation into dollars, and cash paid out to owners, went the other way. |
| Macy’s | Inventory $4.5 billion, property $5.1 billion, and lease right-of-use assets $2.2 billion, inside $16.4 billion. | Assets were almost flat versus the prior year, $16.2 billion. The store base is being edited, not built out. |
| Sears Holdings | On February 3, 2018, total assets were $7.3 billion, down from $9.4 billion the year before. Cash was $182 million. | Closures and sales of assets. The trend was shrinkage. |
| MakeMyTrip | An asset-light marketplace. Cash was $425 million. Intangibles and goodwill are a large share of a small balance sheet. | Assets slipped from $1.83 billion to $1.75 billion. The platform does not own the planes or the hotels. |
Worked answer for Activity 2: liabilities
Highest now: Apple, $286 billion. Lowest among current filers: MakeMyTrip, $1.81 billion, with Infosys next at $6.6 billion. Sears, on its last balance sheet, owed $11.0 billion against $7.3 billion of assets.
Apple’s liabilities are large because the balance sheet is large, and because the company has borrowed while returning cash to shareholders. Total liabilities fell from $308 billion to $286 billion. Shareholders’ equity rose from $57 billion to $74 billion. The accumulated deficit narrowed from $19.2 billion to $14.3 billion. That deficit is what buybacks and dividends did to retained earnings. It is not Sears.
The clean way to see the difference is to put equity next to liabilities.
| Company | Liabilities as a share of assets | What the mix is saying |
| Alphabet | 30% | Equity of $415 billion carries the balance sheet. Liabilities rose, and assets rose faster. |
| Alibaba | 41% | Equity of $162 billion is still the larger slice. A small mezzanine interest sits between liabilities and equity. |
| Infosys | 40% | Liabilities are $6.6 billion, mostly payables, unearned revenue, and employee obligations. Long-term leases are $0.6 billion. This is not a borrowed balance sheet. |
| Walmart | 63% | Accounts payable were $63 billion. That is suppliers financing inventory. Long-term debt was $35 billion, separate from lease obligations. Equity of $106 billion is real, and so is the payable. |
| Macy’s | 72% | Long-term debt $2.8 billion and long-term leases $2.9 billion. Equity rose from $4.0 billion to $4.6 billion. Manageable, and watched. |
| Apple | 79% | Term debt is real. The low equity ratio is mostly capital returned to owners. Cash and securities of about $132 billion sit against the debt. |
| American Airlines | Above 100% | Stockholders’ deficit was $3.7 billion, slightly narrower than the $4.0 billion deficit a year earlier. Debt and finance leases were $29 billion. Operating lease liabilities were $7.0 billion. The fleet is financed. The owners’ book claim is negative. |
| MakeMyTrip | Above 100% | Non-current borrowings rose from about $14 million to about $1.40 billion. Equity attributable to owners swung from $1.20 billion to a deficit of about $68 million. Read the equity statement before treating that as an operating loss. The year was profitable. |
| Sears Holdings | Above 100% | Liabilities $11.0 billion, equity deficit $3.7 billion, cash $182 million. Suppliers and lenders were already ahead of the owners. |
Negative equity has three different causes in this set. Sears earned its deficit by losing money while assets shrank. American’s deficit is the airline pattern: a huge fleet, accumulated losses, and obligations that outlast a good quarter. Apple’s accumulated deficit sits inside positive equity of $74 billion, because buybacks retired stock faster than earnings piled up. Same word, three stories.
How accrual accounting shows up in the same numbers
The income statement records a sale when it is earned. The cash flow statement records it when the customer pays. A short illustration, with invented numbers, makes the gap obvious.
- The owner starts the year with $100 of cash. Assets $100, equity $100.
- Goods that cost $50 are sold on credit for $80. Revenue is $80, cost of goods sold is $50, profit is $30. Receivables are $80. Cash is still $100, minus whatever was paid for the goods. Profit went up. Cash did not.
- The customer pays the $80 later. Profit does not change. Cash does.
That is why operating cash flow and net income are allowed to differ, and why a gap that keeps widening is a question. Inventories that are not selling, and receivables that are not being collected, are the usual place to look.
Apple’s fiscal 2025 is the clean version of the same idea. Net income was $112.0 billion and cash generated by operating activities was $111.5 billion. The two numbers met. Walmart’s did not match, and that is also healthy: operating cash flow of $41.6 billion was about twice net income of $21.9 billion, because depreciation and supplier payables add cash that the income statement has already expensed or not yet recorded as a cost in cash. Infosys is the same shape in miniature. Free cash flow was $3.73 billion, equal to 112.6% of net profit.
Alibaba is the case the original note warns about. Net income was $14.8 billion. Cash from operations was $11.0 billion, down 53% from RMB 164 billion the year before. Free cash flow, the company’s non-GAAP measure, was an outflow of $6.8 billion, against an inflow of RMB 74 billion the prior year. Management attributed the drop to investment in quick commerce and cloud infrastructure. The balance sheet can absorb that. The cash flow statement is still the page that changed.
Worked answer for Activity 3: where the $1 million goes
On the three tests in the original note, Alphabet is the company. This is a reading of the statements for the exercise. It is not a view on the stock price, and a real portfolio would not put $1 million into one name.
The tests, applied to the year ended December 31, 2025:
- Balance sheet. Assets $595 billion, liabilities $180 billion, equity $415 billion. Owners’ equity is the majority of the balance sheet. Long-term debt did rise, from $11 billion to $47 billion, and property and equipment rose from $171 billion to $247 billion. That is borrowing to build, against equity that also rose by $90 billion. Cash and marketable securities rose from $96 billion to $127 billion.
- Income statement. Revenue $403 billion. Net income $132 billion. That is a margin of about 33%. Operating income was $129 billion, so interest and other items are not what produced the profit.
- Cash flow. Cash from operations was $165 billion, above net income of $132 billion. Free cash flow was still $73 billion after capital spending. The business, not a share issue and not a new loan, was the source of cash.
The year-over-year trend in those metrics is up, and the cash line is up with the profit line.
| Alphabet | 2024 | 2025 | Change |
| Revenue | $350 billion | $403 billion | +15% |
| Net income | $100 billion | $132 billion | +32% |
| Cash from operations | $125 billion | $165 billion | +31% |
| Assets | $450 billion | $595 billion | +32% |
| Equity | $325 billion | $415 billion | +28% |
Free cash flow of $73 billion is well below operating cash flow of $165 billion. The gap is capital spending, much of it the infrastructure behind cloud and AI. That is investing cash going out, which is what the investing section is for. It is a different fact from Alibaba’s negative free cash flow in the same season of spending. Alphabet still had cash left. The thing to watch next year is whether operating cash keeps covering that spend.
Why the other eight are not the pick
Apple is the closest business on the income statement and the cash flow statement. Revenue rose from $391 billion to $416 billion. Net income rose from $94 billion to $112 billion. Operating cash flow of $111 billion was roughly equal to profit, which passes the test, though it was down from $118 billion the year before. Products were $307 billion of sales and services were $109 billion. The reason it is second, not first, is the balance sheet lesson: equity is 21% of assets because of buybacks, and the reader has to do extra work to see that this is not distress. Alphabet does not require that extra step.
Walmart is the clean retail case. Revenue was $713 billion, up 4.7%. Net income attributable to Walmart was $21.9 billion, up from $19.4 billion. Operating cash flow was $41.6 billion and free cash flow was $14.9 billion. Payables of $63 billion against inventory of $59 billion are the working-capital engine the original note is pointing at. The reason it is not the pick is the margin. Profit is about 3% of revenue. The statements are healthy. They are the statements of a store network, and a small change in cost or price moves profit by a lot.
Infosys is the clean services case. Revenue was $20.2 billion, up 4.6% in dollars and 3.1% in constant currency. Operating margin was 20.3%. Net profit was $3.31 billion. Free cash flow was $3.73 billion. The board returned more than ₹37,500 crore to shareholders in the year through dividends and a buyback, which is why dollar equity fell from $11.3 billion to $9.8 billion in a profitable year. For the exercise, it is a model of an asset-light company. It is not the single pick only because Alphabet clears the same tests at a scale where the cash from operations is unmistakable.
Alibaba still has the fortress balance sheet: equity $162 billion, liquid investments $75.5 billion. Revenue was $148 billion, up 3%, or 11% if the disposed Sun Art and Intime businesses are left out of both years. Net income fell 19% to $14.8 billion. Cash from operations fell 53%. Free cash flow turned negative. The original test says operating cash should keep up with profit, and that the cash balance of the business should be growing from operations. This year fails that test, for a stated reason. The reason can be right and the cash statement can still be the reason to wait.
American Airlines shows why profit on its own misleads. Operating income was $1.5 billion. Net income was $111 million, down from $846 million, on revenue of $54.6 billion. That is a net margin of about 0.2%. Operating cash flow was $3.1 billion, down from $4.0 billion, so the cash test is kinder than the income statement. The balance sheet is not. A stockholders’ deficit of $3.7 billion means liabilities already exceed assets. A good year pays the fleet. It does not leave a thick residual for the owner.
Macy’s is a year behind the others. The latest full year ended February 1, 2025. Net sales were $22.3 billion, down from $23.1 billion. Net income was $582 million, up from $45 million, which itself followed a heavy impairment year. Operating cash flow was $1.3 billion. Cash on the balance sheet rose to $1.3 billion. Equity rose to $4.6 billion. The statements of this particular year are fine. The multi-year sales line is the caution: net sales were $24.4 billion two years before. A department store can be profitable while it gets smaller.
MakeMyTrip is the marketplace case. Revenue $1.04 billion, up 6.7%. Profit $52 million, down from $95 million. Operating cash flow was $183 million, well above profit, which passes the cash-versus-income test. Gross bookings of $10.4 billion are not revenue. They are the tickets, rooms, and bus seats customers bought from suppliers, and the company’s revenue is its fee. The new fact on the balance sheet is the equity deficit and the $1.4 billion of non-current borrowings. Until that financing is read properly, the statements are not the cleanest place to put the $1 million.
Sears Holdings is the answer the original activity was built to surface. In the year ended February 3, 2018, revenue was $16.7 billion, down from $22.1 billion, and from $25.1 billion the year before that. The net loss attributable to shareholders was $383 million. Assets were $7.3 billion. Liabilities were $11.0 billion. Cash was $182 million. On October 15, 2018, Sears Holdings and affiliated debtors filed for Chapter 11. There is no current stock to buy. The statements had already said the owners’ claim was negative and the cash was thin.
A short order for the next set of statements
Start with the dates, because these nine companies do not close their books on the same day. Then check that assets equal liabilities plus equity. Then ask what the biggest asset actually is: cash, inventory, aircraft, or goodwill. Then put operating cash next to net income. If profit is rising and operating cash is not, stop and find the receivable, the inventory, or the spending that explains it. If equity is negative, do not stop at the word. Ask whether the cause is losses, a financed fleet, a buyback, or a new borrowing.
Figures mix fiscal years, currencies, and attributable versus consolidated profit. Infosys dollar amounts are the company’s IFRS convenience translation. Alibaba dollar amounts use the rate in its results. Sears is the last reported year, not a current filer. This is a study answer to the original exercise, not a recommendation to buy or sell any security.
Sources used for the update: Alphabet fourth-quarter and fiscal-year 2025 results, released February 4, 2026, and the fiscal 2025 balance sheet. Apple’s consolidated financial statements for the year ended September 27, 2025. Walmart’s fourth-quarter and fiscal 2026 release, February 19, 2026, and the balance sheet at January 31, 2026. Alibaba’s fiscal 2026 results and unaudited balance sheet at March 31, 2026. Infosys’s IFRS release for the year ended March 31, 2026, dated April 23, 2026, including the rupee cash flow statement. American Airlines Group’s annual report for the year ended December 31, 2025. MakeMyTrip’s fiscal 2026 results, May 19, 2026. Macy’s fiscal 2024 results for the year ended February 1, 2025. Sears Holdings’ results for the year ended February 3, 2018, and the Chapter 11 petitions filed on October 15, 2018.
The original note is at nlpfy.com/key-financial-statements.
Thank you!


You must be logged in to post a comment.