What a default model reads
A loan or credit-card default model is trying to answer one question: will this account reach a serious delinquency after we book it? A collection model starts later, once the account is already late, and asks a shorter question: over the next cycle, will it cure, stay where it is, roll deeper, or pay something? The CIBIL report and a FICO score are two ways of packing history into something a lender can read. The score is the summary. Many of the parameters sit underneath it. Many others sit only on the lender’s own ledger, and those are the ones collection work actually runs on.
CIBIL, part of TransUnion, is a credit bureau in India. Its consumer score runs from 300 to 900 and is built from the accounts and enquiries on the credit information report. FICO is a scoring company. A classic FICO Score runs from 300 to 850 and is calculated from a credit file stored at Equifax, Experian, or TransUnion in the United States. The report is that bureau file. FICO, and other scores such as VantageScore, are formulas on top of it. Industry FICO Scores used for auto loans and bankcards use a wider range, 250 to 900.
The rest of this piece follows one made-up applicant, Aarav, so the ratios have something to attach to. He wants a new personal loan. His file has a home loan, an older personal loan, and two credit cards. The rupee figures are a worked example. They are not a real person’s report, and they are not a cutoff any lender is required to use.
A model does not score the PDF. It takes raw fields, turns them into a short list of features, and compares those features with a label that is decided later: good or bad on the new account.
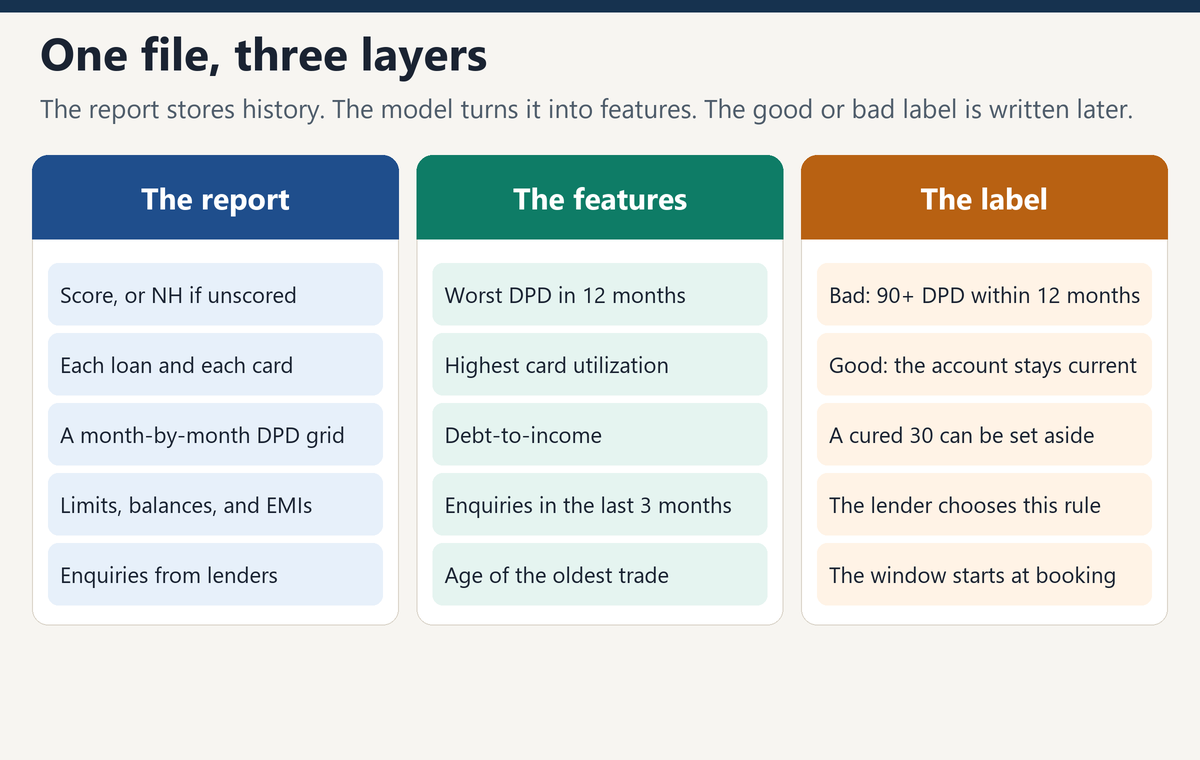
The score is a compression of the file
FICO publishes five groups of facts for the classic score, and a weight for each group. The same page notes that the importance of a group can vary from one person to another. These are the general weights, not a promise about Aarav’s file in particular.
| FICO group | Published weight | What sits inside it |
|---|---|---|
| Payment history | 35% | Whether past accounts were paid on time, and how recent, severe, and frequent any late payments were |
| Amounts owed | 30% | Balances, how many accounts carry a balance, and how much of the revolving limit is in use |
| Length of credit history | 15% | Age of the oldest account, age of the newest, and the average age |
| New credit | 10% | Recent enquiries and newly opened accounts |
| Credit mix | 10% | The blend of revolving accounts and installment loans |
CIBIL describes the same families of facts and does not publish a percentage split. On its own explanation, the score moves with payment history, the mix of secured and unsecured credit, the number of enquiries, and high credit utilisation. Days past due and amounts outstanding are part of that payment and balance record. A person needs more than six months of credit information before CIBIL will calculate a score. With less than that, the consumer report shows NH or NA, for no history or not available. Feeds that lenders load often store the same outcome as a score of -1.
myFICO groups the classic 300 to 850 range like this. A lender’s price sheet can sit anywhere inside a band. One lender’s best rate might start at 730 and another’s at 760.
| FICO Score | myFICO rating |
|---|---|
| 800 and above | Exceptional |
| 740 to 799 | Very good |
| 670 to 739 | Good |
| 580 to 669 | Fair |
| Below 580 | Poor |
CIBIL has published that 79 percent of sanctioned loans go to consumers with a score above 750. That figure is the mix of loans that were approved. A lender can set its cutoff above 750 or below it. Many application models still keep the bureau score as one feature and keep the raw fields beside it. The score has already blended payment history, balances, age, new credit, and mix. A raw field earns its place when it answers something the score hides, such as whether the last 90-day delinquency was last month or three years ago. Both FICO and CIBIL can return reason codes, a short list of the facts that pulled that person’s score down. The codes are a reading aid. The model still wants the numbers.
What one account looks like
The useful detail is the trade line, one row per loan or card. On a CIBIL report the account block names the lender, the type of credit, the ownership, the dates, the amount, the current balance, any amount overdue, and a month-by-month payment record of up to 36 months. A US bureau file carries the same idea: creditor, account type, responsibility, date opened, limit or high credit, balance, past-due amount, and a payment pattern. The date opened can be older than the 36 months shown on the Indian grid. Age uses the open date. The grid is the recent behaviour.
| Field on the trade | What it records | What a model does with it |
|---|---|---|
| Account type | Home loan, auto, personal loan, gold, credit card, overdraft, and so on | Splits secured from unsecured, and revolving from installment |
| Ownership | Individual, joint, guarantor, or authorised user | Keeps a guaranteed loan out of the applicant’s own EMI, and an add-on card out of the applicant’s own limit |
| Date opened and date closed | When the account started, and when it ended if it has ended | Age of oldest, newest, and average trade |
| Sanctioned amount, high credit, or credit limit | What was granted, or the peak drawn on a card | The denominator of utilization, and the original size of an installment loan |
| Current balance | What is still owed | The numerator of utilization, and part of total exposure |
| Amount overdue | The rupees or dollars actually late | Size of the miss. A small overdue at 90 days and a large overdue at 30 days are different facts |
| EMI, tenure, frequency | The contracted installment | The debt-service side of debt-to-income. Blank on many cards |
| Payment status grid | Each month’s days past due, or an asset-class code | 30, 60, 90, and the months since they happened |
| Suit filed, wilful default, written off, settled, restructured | A severe status the lender has reported | Flags that usually dominate a retail model |
30 DPD, 60 DPD, and 90 DPD
DPD means days past due. The count starts on the due date, not on the day the statement was printed. A payment that arrives a few days late and is cleared before it ages into the next bucket can still show as current. Thirty DPD means the account is about a month late. On US files, furnishers report in bands: 30 to 59 days, 60 to 89, 90 to 119, then 120, 150, and 180 or more. Indian grids often print the band as 030, 060, or 090.
On a credit card in India, the Reserve Bank’s rule has two clocks. Days past due are computed from the due date on the statement. A bank reports the card as past due to a credit bureau, or levies a late charge, only when the account has stayed past due for more than three days. Paying the minimum amount due keeps the card out of the non-performing test. The card becomes a non-performing asset if that minimum stays unpaid for 90 days from the due date. A cardholder can show a clean grid for years and still owe most of the limit, because the unpaid remainder revolves. That is why a card model wants utilization next to DPD.
For other loans, RBI’s special-mention bands mark stress before the account is a non-performing asset. More than 90 days overdue is the non-performing line. Under the Basel capital rules used by banks, 90 days past due is also a default, alongside a judgment that repayment has become unlikely. A cash-credit or overdraft has a twin test: the outstanding staying above the sanctioned limit or drawing power. Those revolving facilities enter the special-mention ladder from the 30-day over-limit mark.
| Stage | How late | How a model usually treats it |
|---|---|---|
| A few days late | Past the due date, cured before the 30-day band. On an Indian card, bureau reporting of “past due” waits until more than 3 days | Often invisible on the bureau grid. The lender’s own system may still see it |
| SMA-0 | Up to 30 days | Early stress. Weaker than a reported 30-day band, and easy to miss if you only store 030 |
| 30 DPD, often 030 | Commonly the 30 to 59 day band, which overlaps SMA-1 (more than 30 days, up to 60) | Early-warning feature. Many of these cure. The cure itself is information |
| 60 DPD, often 060 | Commonly 60 to 89 days, around SMA-2 (more than 60 days, up to 90) | A stronger feature. The first miss has rolled forward |
| 90 DPD, often 090 | About three cycles. More than 90 days is an NPA for an Indian bank, and a Basel default | The usual “bad” definition in a retail default model |
| 120, 150, 180 and beyond | Deeper delinquency, then loss paths | Used when the question is loss severity, or how far a bad account went |
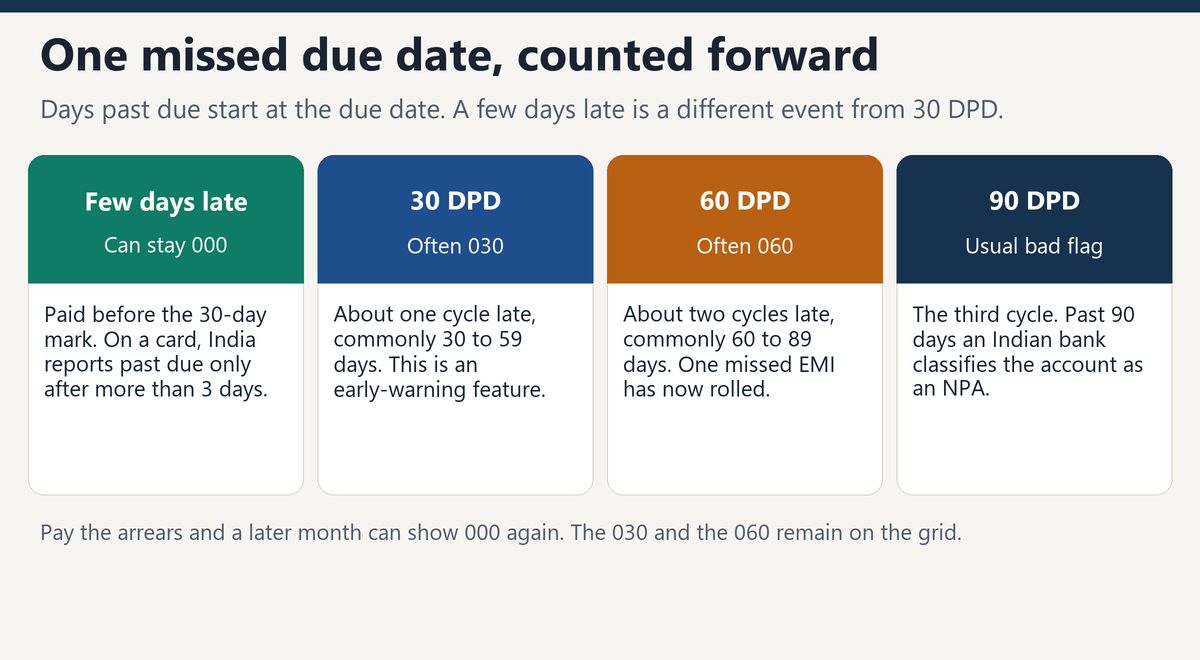
The grid also carries words. 000 is a month with no days past due. XXX means the lender did not report that month. Count 000 as clean. Hold XXX out as missing. A missing month counted as a clean month makes a silent lender look like a punctual borrower. STD means the standard, performing class, so an account can be STD and still show a 030 or a 060. SMA is the special-mention class. SUB is substandard, an NPA in its first stage. DBT is doubtful, after the account has stayed substandard. LSS is loss. Once the arrears are paid, a later month can return to 000. The old 030 and 060 stay in the 36-month string.
Aarav’s personal loan, scored in April 2026, reads like this from November:
| Month | Grid | What happened |
|---|---|---|
| November 2025 | 000 | Paid as agreed |
| December 2025 | 000 | Paid as agreed |
| January 2026 | 030 | One installment about a month late |
| February 2026 | 060 | That same miss is now about two months late |
| March 2026 | 000 | Arrears paid. The account is current again |
Current worst DPD is 0. Worst in the last six months is 60. There are two delinquent months and one episode, because January and February are the same missed EMI rolling forward. Months since the 60 is two, if April is the scoring month. Write down which of those you are counting. A model that counts months and a model that counts episodes are describing different things, and they should not share a name.
Build the delinquency features on a clock, and split them by product when the product matters. A 30 on a credit card and a 30 on a home loan do not have to share one coefficient.
| Feature | How it is built | How to read a larger number |
|---|---|---|
| Current worst DPD | The latest status on open trades | Higher current delinquency, higher risk |
| Worst DPD in 3, 6, 12, and 24 months | The worst cell in that window | A recent 90 outweighs an old 30 |
| Months at 30 or more, 60 or more, 90 or more | Count of delinquent cells, or count of episodes | More delinquency, higher risk. Say which count you used |
| Trades currently 30 or more | Open accounts still late | More accounts in trouble, higher risk |
| Months since the last 30, 60, or 90 | How long ago the latest bad cell was | A smaller number means the problem is fresher |
| Clean months in the last 12 | Cells that are 000 | More clean months, lower risk |
| Worst DPD on cards, on unsecured, on any trade | The same grid, filtered by account type | Use the slice that matches the product you are scoring |
| Amount overdue | Rupees or dollars late right now | A larger overdue, higher risk |
What “defaulter” means
The word is used for three different decisions. Mixing them up is how a clean closed loan gets treated like a write-off, or a 30-day late gets labeled as a Basel default.
| Use of the word | Who defines it | What it looks like on Aarav |
|---|---|---|
| A status on the report | The lender, reporting a severe outcome | Written off, settled, suit filed, wilful default, restructured, or, on a US file, charged off or in collection |
| A regulatory default | RBI for an Indian bank, and the Basel rule for capital models | More than 90 days past due, or a judgment that he is unlikely to pay. On a card, the 90 days apply to the minimum amount due |
| The model’s bad flag | The lender, before the model is fit | A common retail choice is 90 or more days past due inside 12 months of booking. Some card books use charge-off. Some early-warning models use 60 |
Closed means the account ended with nothing written off. Settled means the lender accepted less than the full amount. Written off, or charged off on a US file, means the lender has taken it as a loss. A later payment against a write-off is a post-write-off settlement, which is still a write-off that was partly recovered. Suit filed means the lender has gone to court. Wilful default is a status an Indian lender reports when it has classified the borrower that way under RBI’s framework. Restructured means the contract was changed because repayment was in trouble. A restructured loan can be current on its new schedule and still be a severe flag, because the change itself is the evidence.
Indian reports also carry the amounts: settlement amount, principal written off, and total written off. The flag says it happened. The amount says how large it was.
The bad flag used in training is a choice, so write it down before looking at the coefficients. A common pattern is to call 90 or more days past due “bad,” to call a never-delinquent account “good,” and to set aside the middle, the accounts that touched 30 or 60 and then cured. That middle band is indeterminate. Leaving it in as “good” teaches the model that a 60 is harmless. Leaving it in as “bad” teaches the opposite. Aarav’s cured 60, on a loan that is now current, would fall in that middle if the lender uses this split.
Two clocks sit on top of the flag. The observation date is the day the features are measured, which for an application model is the day the application is scored. The performance window is the period afterward in which the bad event is allowed to happen. Twelve months is a common retail window. It is the lender’s choice. Features measured after booking, or a bad flag defined with a field the model is also using as an input, will make the fit look better than the next year’s applications.
Credit utilization
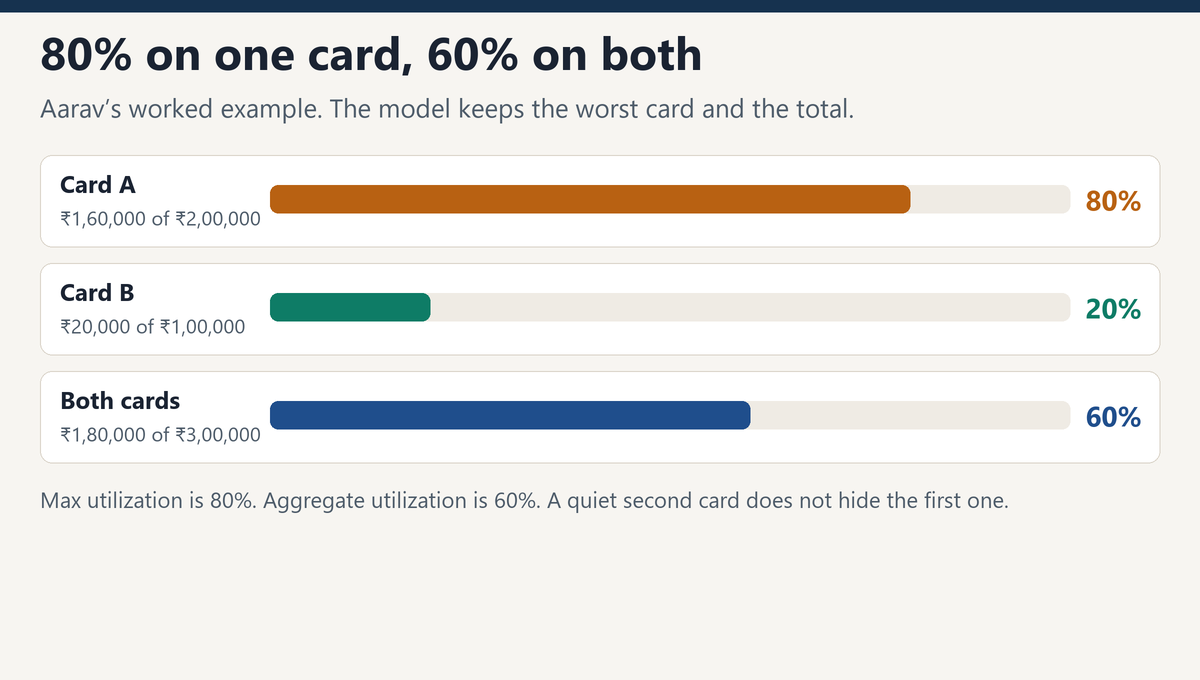
Utilization is a revolving-credit ratio. On one card it is the current balance divided by the credit limit. Across cards it is the sum of balances divided by the sum of limits. FICO puts this inside “amounts owed,” which is 30 percent of the classic score, along with how many accounts carry a balance and how the debt is spread. Utilization is the famous part of that 30 percent. It is not the whole of it.
Aarav’s cards:
| Card | Balance | Limit | Utilization |
|---|---|---|---|
| Card A | ₹1,60,000 | ₹2,00,000 | 80% |
| Card B | ₹20,000 | ₹1,00,000 | 20% |
| Both | ₹1,80,000 | ₹3,00,000 | 60% |
The aggregate is 60 percent. The worst card is 80 percent. Keep both. A model that stores only the aggregate will treat Aarav as a moderate user and miss the card that is nearly full. A zero limit makes the ratio undefined, so drop that card or handle it on its own. An over-limit card, balance above the limit, is a flag of its own, past any percentage.
An installment loan does not have a limit in this sense. The parallel ratio is the current balance divided by the sanctioned amount. On a home loan that ratio starts high and falls as the loan amortizes, so a high ratio in year one is ordinary. Read it next to the age of the loan, or compare it inside one product. High credit, the peak amount ever billed or drawn, is a third number. It shows how far the borrower has pushed the account, even if this month’s balance is lower.
Consumer advice often mentions keeping utilization under 30 percent. That is advice, not a coefficient. The model can use the ratio as a continuous number, or in bands the data supports. The same is true of “number of cards with a balance.” FICO looks at it. The point at which it starts to matter is something the lender’s own accounts have to show.
Debt-to-income
Debt-to-income is monthly debt payments divided by gross monthly income. In Indian retail the same idea is usually called FOIR, the fixed-obligation-to-income ratio. Some lenders put net income in the denominator. Say which one you used. The classic FICO Score does not contain this ratio. Income is not an input to that score. The bureau file has the EMIs, when lenders report them. The application, or a verified salary, has the income. The ratio is built at the lender, by joining the two.
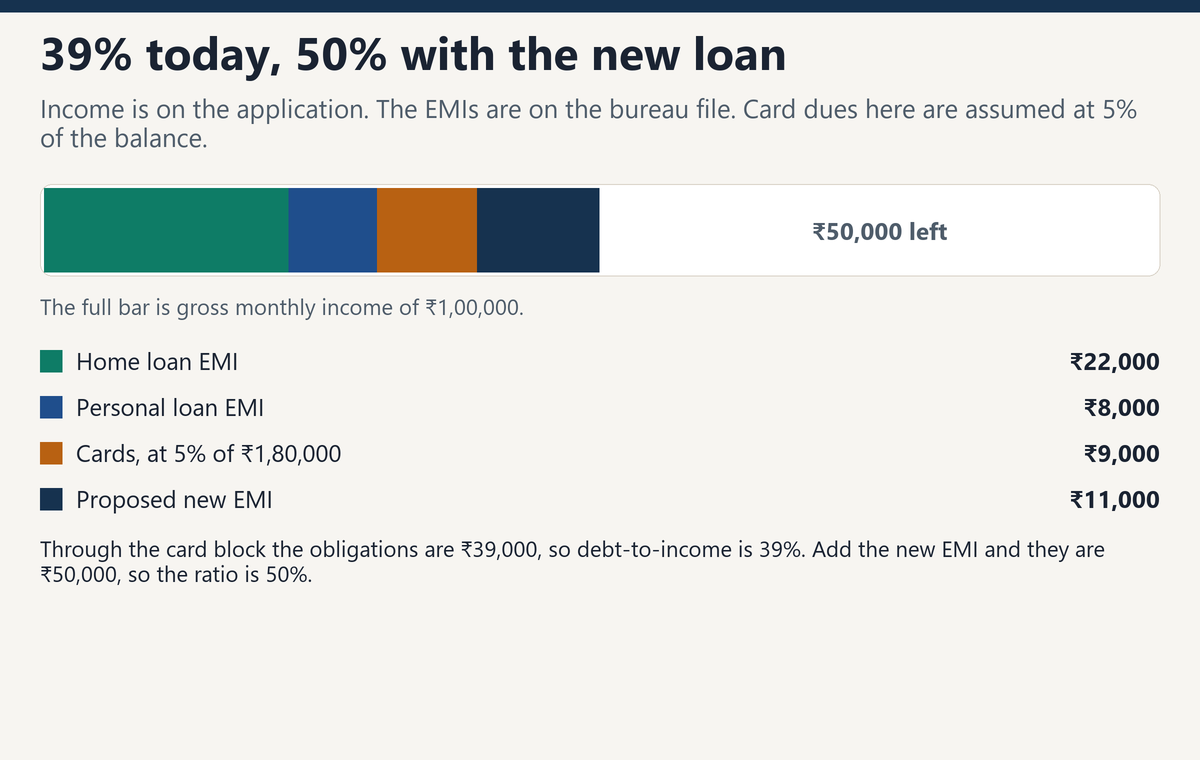
Aarav’s gross monthly income is ₹1,00,000. His home loan EMI is ₹22,000 and his personal loan EMI is ₹8,000. The cards do not show an EMI. This example assumes a card obligation of 5 percent of the card balance, which is ₹9,000 on ₹1,80,000. That 5 percent is an assumption for the example, not a CIBIL field. Write the assumption into the model documentation if you use one.
Obligations today are ₹22,000 + ₹8,000 + ₹9,000 = ₹39,000. Debt-to-income today is 39,000 / 1,00,000 = 39%. The new personal loan would add an EMI of ₹11,000. Obligations become ₹50,000, and the ratio becomes 50%. At application, include the proposed EMI. A ratio that ignores the loan you are about to book will understate the burden you are about to create. A guarantor trade is someone else’s loan. Keep it out of this sum unless your policy treats the guarantee as his obligation.
The acceptable level is a policy the lender writes. It can also be a feature in the model, so a high ratio raises predicted default risk even when it sits under the policy cap. US mortgage underwriting sometimes splits a housing ratio, the proposed home payment over income, from a back-end ratio that includes every debt. Indian personal-loan and card books usually keep one ratio and are explicit about whether the card piece is a reported minimum or an imputed share of the balance.
The other parameters
The fields below are the rest of what typically enters a retail application model. Each one is a summary of the trade lines and the enquiry list. Direction is the usual one in unsecured and card books. The size of the effect is what you estimate on the lender’s own history. Copying FICO’s 35 percent onto your “worst DPD” feature would be a category error. That 35 percent is a share of a score, not an odds ratio for one variable.
Severe marks
| Parameter | Where it lives | Presence on the file |
|---|---|---|
| Written off or charged off | Account status, plus any write-off amount | A loss already taken. Strongly higher risk |
| Settled | Status and settlement amount | Paid for less than was owed. Higher risk, and distinct from closed |
| Suit filed | Status | Higher risk |
| Wilful default | Status under the Indian framework | Higher risk |
| Restructured | Status | Higher risk, including when the new schedule is current |
| Substandard, doubtful, loss | SUB, DBT, LSS on the grid | The account is already in an NPA stage |
| Collection or bankruptcy | US public record or a collection trade | Higher risk. Newer FICO versions do not treat every collection the same way, so name the score version if you are explaining a score movement |
| Months since the severe mark | The date of the status | A recent write-off is more serious than an old one |
Balances, limits, and enquiries
| Parameter | Formula or source | How to read it |
|---|---|---|
| Aggregate revolving utilization | Sum of card balances / sum of limits | Higher, higher risk. Aarav is at 60% |
| Maximum utilization | The fullest open card | Aarav is at 80% on card A |
| Accounts with a balance | Count of trades whose balance is above zero | Part of amounts owed. More of them spreads the debt |
| Over-limit | Balance above the limit or the drawing power | A flag, beyond the percentage |
| Outstanding / sanctioned | Installment loans only | Read it with the age of the loan |
| Total outstanding and total limit | Sums across the file | Exposure and spare capacity. Store them together |
| Enquiries in 1, 3, 6, and 12 months | The enquiry section. Count applications, not the borrower checking their own score | A cluster of applications raises risk |
| Months since the last enquiry | Date of the latest lender enquiry | A smaller number means the search for credit is fresher |
| Trades opened in 3, 6, and 12 months | Date opened | New accounts raise risk, especially unsecured ones |
| Enquiries that never became a trade | Applications with no account opening afterward | Can mean another lender already declined |
| Unsecured enquiry count | Enquiry purpose: personal loan, card, and similar | The usual stress signal. A mortgage shopping spell is a different pattern |
FICO treats a tight cluster of mortgage or auto enquiries as rate shopping rather than as a pile of separate applications. The length of that window depends on the score version. CIBIL lists each lender enquiry with a date and a purpose. A model on an Indian file usually counts them in a 3-month and a 6-month window and lets the data decide the weight. Checking your own CIBIL or FICO score is not one of these enquiries.
Age, thickness, and mix
| Parameter | How it is built | How to read it |
|---|---|---|
| Age of the oldest trade | Months since the earliest open date | An older file is generally lower risk |
| Average age of open trades | Mean of those ages | Older, generally lower risk |
| Age of the newest trade | Months since the latest open date | A very new trade is a new-credit signal |
| Open trades, and open cards | Counts | A handful of trades is a thin file. A sudden jump in the count is new credit. Read the count next to the ages |
| Satisfactory closed trades | Closed accounts that were paid as agreed | They still support age and payment history |
| Secured and unsecured counts | Account type | This is the mix. CIBIL names a balance of secured and unsecured as a positive. The model can test that on your book |
| Thin file, NH, NA, or -1 | Too little history to score. CIBIL’s line is six months of information | A separate path. There is no 300-to-900 rank to sort on |
| Number of lenders | Distinct members reporting a trade | Debt spread across many lenders is a stress signal in many unsecured books |
Identity fields are for matching the file to the applicant: name, date of birth, PAN or Social Security number, addresses, and phones. They are not default parameters. Employment on an Indian report is often incomplete. Use it to check the application, and keep it out of the default formula unless you have tested it as a real predictor.
What the lender can see and the bureau cannot
A behavioral model scores accounts the lender already booked, usually every month. It can use everything above, from a fresh bureau pull, and it can use the lender’s own ledger. Those ledger fields never appear on CIBIL or on a FICO file.
| Parameter on the lender’s book | What it measures | Why card and loan models use it |
|---|---|---|
| Months on book | How long this account has been open | The first months after booking are a different risk from a seasoned account |
| Payment rate | Amount paid divided by the statement balance | Paying the minimum keeps DPD at zero and still marks a revolver |
| Cash advances | Cash drawn on a card in recent statements | Borrowing cash on the card is a stress signal |
| Delinquency on this account | The lender’s own days past due, before the bureau is updated | It sees a roll toward 30 sooner than the next CIBIL or Metro 2 report |
| Utilization trend | Balance over limit across recent statements | A rising ratio is an early warning while the grid still says 000 |
| Returned payments | Payments that bounced | A broken payment, even if a later one cures the DPD |
Early-warning fields on a live account
Once the account is booked, default risk is no longer only the bureau file at application. The sharpest signals are on the repayment instruction and on the statements. A bounced debit can show up before the next CIBIL grid does.
| Parameter | What it measures | How a default model uses it |
|---|---|---|
| First-payment default | The first EMI, or the first card minimum, is missed | A very early flag. It often marks a loan that was wrong from the start, or a mandate that never worked |
| Second-payment default | The next due is missed as well | Separates a setup failure that was fixed from an account that is already rolling |
| Ever 30, ever 60, ever 90 | Whether that level appears anywhere on the history, even if the account is current today | Aarav is ever-60 and currently 0. Current DPD alone would call him clean |
| Streak of minimum-due payments | How many card statements in a row were paid at the minimum | DPD stays 0. The balance usually does not |
| Balance change over 3 and 6 months | Rise or fall in the amount owed | A rising balance is an early-warning feature beside the level of utilization |
| Times over the limit in 12 months | Count of over-limit months, not only today’s flag | Repeated trips over the limit are a stronger signal than one |
| Recent limit cut or increase | The lender changed the limit, and when | A cut is often the lender’s own reaction. Treat it carefully, or the model learns the lender’s last decision rather than the borrower |
| NACH, ECS, or cheque bounce | An EMI presentment was returned | An early default signal in Indian retail. “Insufficient funds” and “mandate cancelled” should be stored as different reasons |
| Mandate status | The auto-debit is active, cancelled, or expired | A cancelled mandate removes the path the EMI was supposed to take |
| Other products at the same lender | Whether the card, the personal loan, and the home loan are late together | One late product is a different pattern from every product late |
| Salary credit and average balance | From a bank statement or an account-aggregator feed | Capacity. Neither CIBIL nor a FICO file carries the monthly salary credit |
| Vintage, or months on book | Months since this account was booked | Read the bad rate as a curve along months since booking. Month 2 and month 24 are not the same risk even at the same utilization |
Expected loss is three numbers
A default probability is not yet a loss. Banks split the loss into three pieces and multiply them. The product is the expected loss on that account. Each piece has its own model, because the facts that move one of them often leave the others alone.
| Piece | What it is | What it is built from |
|---|---|---|
| Probability of default (PD) | The chance the account hits the bad definition inside the window | The delinquency, utilization, enquiry, income, and early-warning fields above |
| Exposure at default (EAD) | The balance expected if that default happens | Today’s balance. On a card or an overdraft, add a share of the undrawn limit. That share is a conversion factor estimated from how much undrawn limit defaulted accounts actually drew. It is not a fixed industry percentage |
| Loss given default (LGD) | The share of that exposure that is not recovered | Recoveries after default or write-off, minus costs, over a stated number of months. LGD and the recovery rate are the same fact written from opposite ends, once costs and timing are defined the same way |
Accounting uses the same three ideas on a different clock. Under IFRS 9, a performing account in stage 1 carries a 12-month expected credit loss. Stage 2 is a significant increase in credit risk, and the loss becomes lifetime. The standard has a rebuttable presumption that 30 days past due marks that increase. Stage 3 is credit-impaired, and the loss is lifetime. A second rebuttable presumption says that 90 days past due means default, which is the same line RBI uses for a non-performing asset and Basel uses for default. A collection book is mostly stage 3, plus the stage 2 accounts that are late and still might cure. A bank can rebut either presumption, and it has to document how.
What a collection model reads
By the time an account is in a bucket, the origination question has already been answered. The useful horizon shrinks to the next cycle, often 30 days and sometimes 60. The outcomes are no longer a single “bad” flag. From a bucket, an account can cure back toward current, stay where it is, or roll to the next worse bucket. It can also pay a part of what is overdue and remain late. After write-off, cure is no longer the question. The question is how many rupees come back, and how many months that takes.
An origination CIBIL score or a classic FICO score is a weak stand-in for that decision. Those scores rank the chance of serious delinquency over a long window, on a file that looked current at the time. A collection score ranks a short-window chance of payment or cure on an account that is already late. Lenders build that score themselves or buy a specialist score. Either way, the inputs below are the ones the model is usually given.
Take a worked month, the same way Aarav’s file was a worked application. One hundred accounts start in the 30 DPD bucket. By the next month, 50 are current again, 10 are still around 30 days late, and 40 have moved to 60. Cure rate is 50/100. The stay rate is 10/100. The roll-forward rate is 40/100. These counts are the example. They are not a rate you should copy onto a live book. Your book’s rates are a table you measure every month, by product and by bucket.
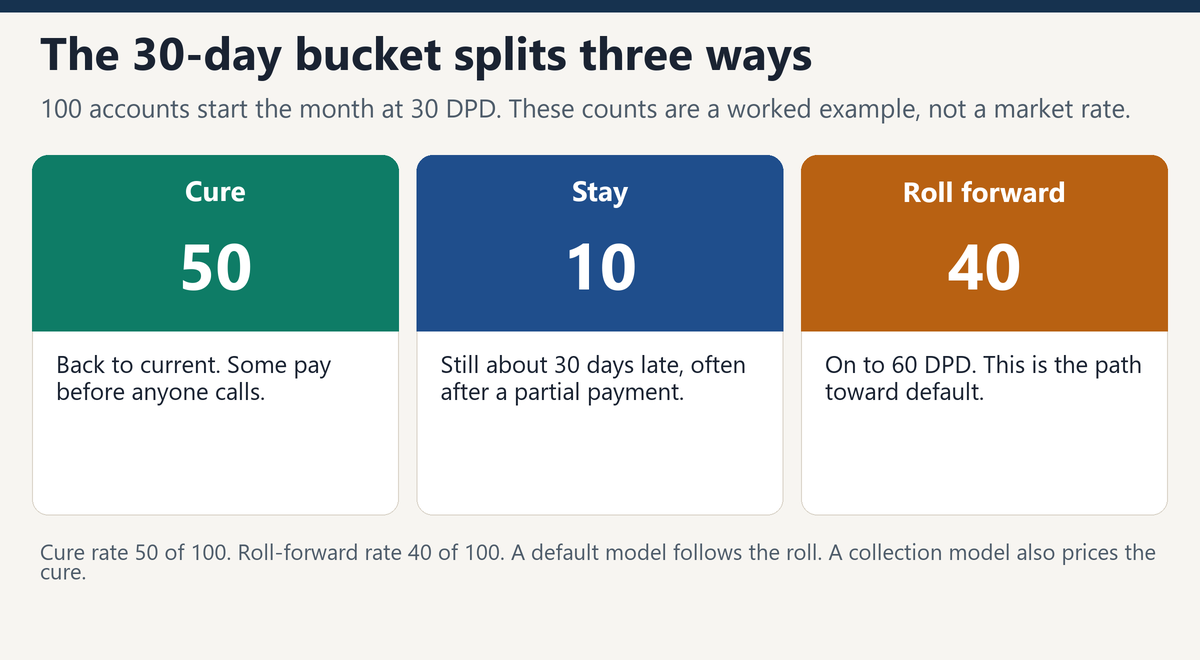
Suppose 30 of the 50 cures had no conversation with a collector, and 20 paid after a contact. The 30 are self-cures. The 20 are not proof that the contact caused the payment. People who were going to pay are also easier to reach. A fair test compares similar accounts that were worked with similar accounts that were left alone, over the same bucket and the same month. The self-cure rate is why a collection model is not just a default model run again. Calling an account that would have paid anyway spends the cost and adds no recovery.
The state of the account
| Parameter | What to store | Why collection treats it separately |
|---|---|---|
| Bucket and days in bucket | 1–29, 30, 60, 90, 120, 150, 180 and beyond, then written off, plus how many days the account has already sat in this bucket | Every roll rate starts from a bucket. Day 31 and day 58 are both “30 DPD,” and they do not have the same chance of curing this week |
| Amount past due and total balance | Both rupee amounts | A ₹2,000 minimum late on a ₹1,60,000 card is a different job from ₹1,60,000 that is itself late |
| Past due divided by balance | The ratio | High when several EMIs have stacked. Low when only the latest minimum is late |
| Last payment date and amount | The most recent credit, including a partial one | A payment last week is a stronger near-term signal than a bureau grid that has not refreshed |
| Payments during this spell | Count and sum of amounts paid since the account went late | Partial payments are evidence the borrower is still trying |
| Length of this spell | Cycles since this delinquency began | A first-time 30 is a different account from the fourth month of the same missed EMI |
| Prior spells and prior cures | How often the account entered collection in 12 and 24 months, and how often it returned to current | A borrower who has cured twice already is not the same as a first spell |
| Worst bucket ever reached | The deepest delinquency on this account | Separate from the bucket today |
| Secured or unsecured, and loan-to-value if secured | Collateral value divided by exposure | Secured recovery can follow the collateral. A plain personal loan or a card has no security to enforce. In India, SARFAESI is a secured-creditor path. It is not the path for an unsecured card |
| A fresh bureau pull | Whether other lenders’ trades have also gone late, and whether new enquiries appeared after this account went late | If every lender is late, the problem is capacity. If only this account is late, look for a failed mandate, a dispute, or unwillingness |
Promises, contact, and the path already tried
| Parameter | What to store | How to use it |
|---|---|---|
| Promises made, kept, and broken | Three counts, not one | A kept promise and a broken promise are opposite evidence. A single “number of promises” mixes them |
| Open promise and its date | A promise whose date has not arrived | The account may already be inside an agreed plan |
| Right-party contact | A conversation with the borrower, and the date of the last one | Speaking to someone else in the household is a different event. Days since the last right-party contact is the recency feature |
| Attempts since entering the bucket | Calls, messages, and visits | Effort. It is not the same thing as contact |
| Contactability | A working phone, a working address, a working email | An unreachable account needs a different path from a model that assumes a call can be completed |
| Dispute or fraud flag | The case status | Leave these out of a willingness-to-pay model. The non-payment may not be a credit outcome |
| Hardship or forbearance | An active plan that has changed the amount due | Score the plan. The old DPD, read as if the contract had not changed, will mis-state the arrears |
| Legal stage | Reminder, formal notice, suit filed, decree | A later stage means the earlier cures did not happen. Suit filed is also a bureau status, already on the Indian report |
| One-time settlement | Offered, accepted, lapsed, or paid, and the amount | Acceptance is an outcome the model can learn. The offer itself is a policy choice, not a fact about the borrower |
| Latest NACH or cheque return | The reason code on the failed presentment | Insufficient funds, account closed, and mandate cancelled point at different next actions |
Cure, roll, and recovery
Measure the rates on counts of accounts and again on rupees. A high cure rate on small balances can sit next to a low cure rate on the balances that matter. Use the same starting snapshot for every rate, so cure plus stay plus roll-forward equals the accounts you started with. In the worked month, 50 + 10 + 40 = 100.
| Parameter | Definition | In the worked month |
|---|---|---|
| Cure rate | Accounts that returned to current, divided by accounts that started in the bucket | 50/100 |
| Stay rate | Accounts still in that same bucket | 10/100 |
| Roll-forward rate | Accounts that moved to the next worse bucket | 40/100 |
| Self-cure | Cures with no right-party contact during the window | 30 of the 50 cures, in the story above |
| Expected payment | The chance of a payment in the window, times the amount if it happens | The usual target of a collection score. Estimate both pieces on your book |
| Recovery rate | Rupees recovered after write-off, divided by the amount written off, over a stated number of months and after costs | Not in the 30 DPD example. This starts once the account has been written off |
| Months since write-off | The clock on the recovery book | Time the recoveries. On many books they arrive earlier and then thin out. The speed is something you measure |
| LGD | The unrecovered share of exposure at default, consistent with the recovery rate | Feeds capital and IFRS 9. It is the collection outcome, written as a loss share |
Flow these rates forward and you have the collection forecast. Accounts enter from current into the early bucket. Each bucket then cures, stays, or rolls. The last performing bucket rolls into write-off. The written-off stock then yields a recovery over later months. A default model cares most about the chance of reaching the bad line. A collection model cares about every arrow, because the arrow decides who gets a call, who is left to self-cure, and what the unrecovered balance will be.
Put Aarav’s file on one window
An application model for his new personal loan would freeze the features on the day he applies, then wait. A common retail definition, and only a common one, is the table below. A behavioral model on one of his existing cards would use the same feature families and would start the window from a statement date instead of from a booking date.
| Piece | Aarav’s application model |
|---|---|
| Observation date | The day the application is scored |
| Payment history used | His personal loan shows 000, 000, 030, 060, 000, cured by March |
| Utilization used | 80% on the worst card, 60% across both |
| Debt-to-income used | 50%, because the new EMI of ₹11,000 is included. It is 39% without that EMI |
| Performance window | The 12 months after booking |
| Bad | 90 or more days past due on the new loan inside that window |
| Good | Never 30 days past due in that window |
| Set aside, if you use an indeterminate band | Reached 30 or 60 and then cured |
His cured 60 and his 80 percent card can point different ways, and a policy rule on the 50 percent ratio can decline the loan before the model’s score is the thing that decides. That is the point of keeping the parameters separate. The bureau score will have blended them. The feature list lets the lender see which fact did the work.
What to do with the list
- Define “bad” before you fit anything. For a retail loan or card book, write down whether bad means 90 or more days past due, a charge-off, or a write-off, and how many months you will wait to observe it.
- Treat 000 as clean and XXX as missing. Treat a payment a few days late as a different event from 030.
- Store current DPD, worst DPD on a stated window, the count of delinquent months, and the months since the last 30, 60, and 90. Say whether you are counting months or episodes.
- Store aggregate utilization and the worst card. On installment loans, store outstanding over sanctioned next to the age of the loan.
- Build debt-to-income at the lender. Name the income, gross or net. Name the card rule, a reported minimum or an imputed percent. Include the EMI you are about to sanction. Leave guarantor and authorised-user trades out of that sum unless policy says otherwise.
- Keep written-off, settled, suit-filed, wilful, and restructured as their own flags. Closed and settled are different outcomes.
- Count lender enquiries on a stated window. Leave the applicant’s own score check out of the count.
- On a card book, add the lender’s payment rate, cash advances, and utilization trend. A minimum-due payer can have a perfect DPD grid.
- Add the early-warning fields that the bureau sees late: first-payment default, NACH or cheque returns, mandate status, and a salary credit from the bank statement.
- Keep probability of default, exposure at default, and loss given default as three models. On a card, exposure includes undrawn limit only through a conversion factor you estimate from defaulted accounts.
- For accounts already late, store the bucket, the days already spent in it, the amount past due, the last payment, and the length of this spell. Measure cure, stay, and roll-forward from the same snapshot, on accounts and on rupees.
- Split promises into made, kept, and broken. Split cures into self-cure and cures after a right-party contact. Leave dispute and fraud cases out of a willingness-to-pay model.
- If you also use the CIBIL score or a FICO score, know that it already contains payment history, balances, age, new credit, and mix. A collection decision wants a short-window score on an account that is already late. The origination score was built for a different question.
FICO’s category weights and score bands are the ones myFICO publishes for the classic FICO Score, and FICO notes that the weight of a category can vary by person. Industry FICO Scores use 250 to 900. CIBIL’s score range, the six-month history needed before a score is calculated, the NH and NA outcomes, the factors it names, and the figure that 79 percent of sanctioned loans go to scores above 750 are from TransUnion CIBIL’s own explanations. CIBIL does not publish a percentage split of its score. The 90-day line follows RBI’s non-performing and special-mention norms, including the credit-card rule on the minimum amount due, and the Basel definition of default. IFRS 9’s rebuttable presumptions, that 30 days past due marks a significant increase in credit risk and that 90 days past due means default, are part of that accounting standard. Aarav’s balances, EMIs, and the 5 percent card assumption are a worked example. So is the month in which 100 accounts at 30 DPD split into 50 cures, 10 stays, and 40 rolls.

